目录
震荡技术指标(Oscillator Technical Indicator)是一种用于分析金融市场的技术指标,用于衡量资产价格在一段时间内的超买和超卖情况。震荡指标可以帮助交易者识别市场转折点或价格趋势的反转。
震荡指标的计算通常是将某种价格指标(例如收盘价、开盘价、最高价或最低价)进行处理,使其在某个范围内波动,有些指标可能有负值。震荡指标通常是以线性的形式展示。
本次将会为各位其中的一种震荡技术指标——阿隆指标。
阿隆指标(Aroon Indicator)是一种用于测量金融市场趋势强度和方向的技术分析工具。它由 Tushar Chande 于 1995 年开发。该指标由两条线组成,即Aroon Up 和 Aroon Down。
阿隆指标的取值范围在0到100之间。当 Aroon Up 高于 Aroon Down 时,表明上涨趋势占优势;当 Aroon Down 高于 Aroon Up 时,表示下跌趋势占优势。交易者和分析师利用这些信息来识别潜在的趋势变化,因为两条线的交叉可能预示著市场方向的转变。
本文使用 Mac 作业系统以及 jupyter notebook 作为编辑器。
import pandas as pd
import re
import numpy as np
import tejapi
import plotly.express as px
import matplotlib.pyplot as plt
import matplotlib.ticker as mticker
from matplotlib.pyplot import MultipleLocator
from sklearn.linear_model import LinearRegression
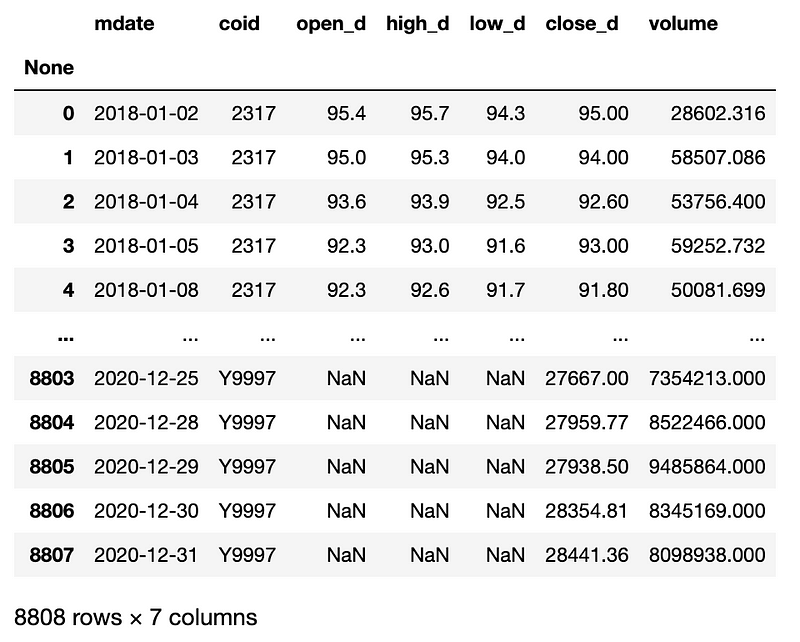
import datetime资料期间从 2018–01–01 至 2020–12–31,以电子股:鸿海精密(2317)、仁宝电脑(2324)、国巨(2327)、台积电(2330)、联强(2347)、宏碁(2353)、鸿准(2354)、(华硕2357)、瑞昱(2379)、广达(2382)、研华(2395) 作为实例,抓取未调整的开、高、收、低价格资料,并以报酬指数(Y9997)作为大盘进行绩效比较。
stock_id = ["Y9997", "2317", "2324", "2327", "2330", "2347", "2353", "2354",
            "2357", "2379", "2382", "2395"]
gte, lte = '2018-01-01', '2020-12-31'
stock = tejapi.get('TWN/APRCD',
                   paginate = True,
                   coid = stock_id,
                   mdate = {'gte':gte, 'lte':lte},
                   opts = {
                       'columns':[ 'mdate', 'coid', 'open_d', 'high_d', 'low_d', 'close_d', 'volume']
                   }
                  )
将 DataFrame 转置,排除大盘资料,以股票代码切分资料。
data_pivot = pd.pivot_table(stock[stock.coid != "Y9997"], columns="coid", index="mdate")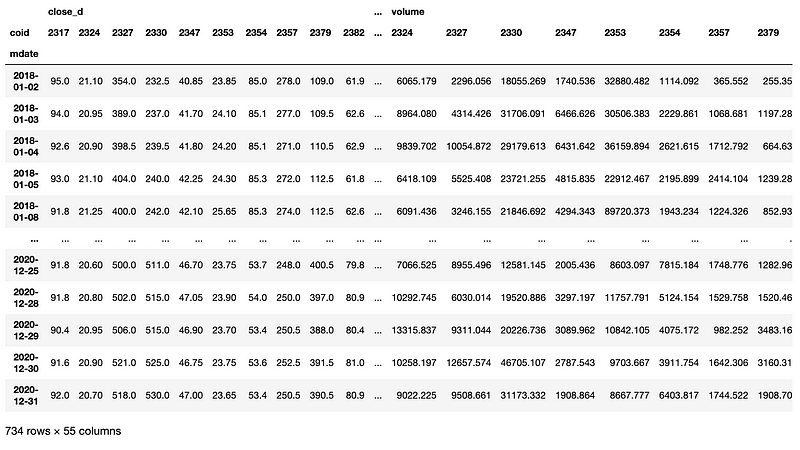
首先我们需要定义下列参数:
由于本次实作包含多个标的,因此我们使用回圈创建一个 dictionary 以保存下列资讯:
以 aroon_record 这个 list 记录每支标的的 “代码”、“日期”、“Aroon-up”、“Aroon-down” 等指数。
接著,为了在最终衡量投资组合的绩效,我们建立 daily_stock_value_record 与 daily_cash_value_record 两个 list 记录每日标的的 “持有部位数”、“股票价值”、“剩余现金价值”。
当 Aroon Up 大于 80 且 Aroon Down 小于 45 时,表示目前上涨趋势高,视为进场的讯号,以隔日开盘价买入一单位。
当 Aroon Up 小于 45 、 Aroon Down 大于 55 且 两指标相差大于 15 时,视为接下来有可能股价跌落的讯号,以隔日开盘价抛售持有部位。
当 Aroon Up 大于 55 、 Aroon Down 小于 45 且 两指标相差大于 15 时,以及满足本金充足、标的投入成本不超过本金的百分之二十时,则继续加码一单位。
def Aroon_strategy_multi(data_pivot, principal, cash, order_unit, n):
    trade_book = pd.DataFrame()
    aroon = pd.DataFrame(columns=["coid", "mdate", "AroonUp", "AroonDown"])

    daily_stock_value_record = []
    daily_cash_value_record = []

    coid_dict = {}
    for i in list(data_pivot.high_d.columns):
        coid_dict.update({i:{"position":0, "invested_principal":0}})

    for ind in range(len(data_pivot.index) - n -1):
        for col in data_pivot.high_d.columns:
            high_period = data_pivot.high_d[col].iloc[ ind : ind+n].reset_index()
            AroonUp = round((high_period.idxmax()[1] + 1)/n*100)

            low_period = data_pivot.low_d[col].iloc[ ind : ind+n].reset_index()
            AroonDown = round(((low_period.idxmin()[1] + 1)/n*100))


            aroon = aroon.append({
                "coid":col,
                "mdate":data_pivot.index[ind+n],
                "AroonUp":AroonUp,
                "AroonDown":AroonDown,
            }, ignore_index=True)

            n_time = data_pivot.index[ind+n+1]
            n_open = data_pivot.open_d[col].iloc[ind+n+1]


            if coid_dict.get(col).get("position") == 0: #进场条件
                if (AroonDown < 45) and (AroonUp > 80):
                    position = coid_dict.get(col).get("position")

                    order_time = n_time
                    order_price = n_open
                    order_unit = 1
                    friction_cost = (20 if order_price*1000*0.001425 < 20 else order_price*1000*0.001425)
                    total_cost = -1 * order_price * 1000 - friction_cost
                    cash += total_cost

                    coid_dict.update({col:{"position":position+1, "invested_principal":order_price * 1000,}})

                    trade_book = pd.concat([trade_book,
                                           pd.DataFrame([col, 'Buy', order_time, 0,  total_cost, order_unit, coid_dict.get(col).get("position"), cash, order_price])],
                                           ignore_index = True, axis=1)

            elif coid_dict.get(col).get("position") > 0:
                if (AroonDown - AroonUp) > 15 and AroonDown > 55 and AroonUp < 45: # 出场条件
                    order_unit = coid_dict.get(col).get("position")
                    cover_time = n_time
                    cover_price = n_open
                    friction_cost = (20 if cover_price*order_unit*1000*0.001425 < 20 else cover_price*order_unit*1000*0.001425) + cover_price*order_unit*1000*0.003
                    total_cost = cover_price*order_unit*1000-friction_cost
                    cash += total_cost

                    coid_dict.update({col:{"position":0, "invested_principal":0}})

                    trade_book = pd.concat([trade_book,
                                           pd.DataFrame([col, 'Sell', 0, cover_time,  total_cost, -1*order_unit, coid_dict.get(col).get("position"), cash, cover_price])],
                                           ignore_index = True, axis=1)

                elif (AroonUp - AroonDown) > 15 and (AroonDown < 45) and AroonUp > 55 and (cash >= n_open*1000) and (coid_dict.get(col).get("invested_principal") <= 0.2 * principal): #加码条件
                    order_unit = 1
                    order_time = n_time
                    order_price = n_open

                    position = coid_dict.get(col).get("position")

                    friction_cost = (20 if order_price*1000*0.001425 < 20 else order_price*1000*0.001425)
                    total_cost = -1 * order_price * 1000 - friction_cost
                    cash += total_cost

                    invested_principal = coid_dict.get(col).get("invested_principal")
                    coid_dict.update({col:{"position":position+1, "invested_principal": invested_principal + order_price*1000}})

                    trade_book = pd.concat([trade_book,
                                           pd.DataFrame([col, 'Buy', order_time, 0, total_cost, order_unit, coid_dict.get(col).get("position"), cash, order_price])],
                                           ignore_index = True, axis=1)

            daily_stock_value_record.append({
                "mdate": n_time,
                "coid":col,
                "position":coid_dict.get(col).get("position"),
                "stock_value":coid_dict.get(col).get("position") * data_pivot.close_d[col].iloc[ind+n+1] * 1000,
            })
        daily_cash_value_record.append(cash)

    for col in data_pivot.high_d.columns:# 最后一天平仓

        if coid_dict.get(col).get("position") > 0:

            high_period = data_pivot.high_d[col].iloc[ -n : -1].reset_index()
            AroonUp = round((high_period.idxmax()[1] + 1)/n*100)
            low_period = data_pivot.low_d[col].iloc[ -n : -1].reset_index()
            AroonDown = round(((low_period.idxmin()[1] + 1)/n*100))

            order_unit = coid_dict.get(col).get("position")
            cover_price = data_pivot.open_d[col].iloc[-1]
            cover_time = data_pivot.index[-1]
            friction_cost = (20 if cover_price*order_unit*1000*0.001425 < 20 else cover_price*order_unit*1000*0.001425) + cover_price*order_unit*1000*0.003
            cash += cover_price*order_unit*1000-friction_cost

            coid_dict.update({col:{"position":0, "invested_principal": 0,}})

            trade_book = pd.concat([trade_book,
                                   pd.DataFrame([col, 'Sell',0, cover_time, cover_price*order_unit*1000-friction_cost, -1*order_unit, 0, cash, cover_price])],
                                   ignore_index=True, axis=1)

            daily_stock_value_record.append({
                "mdate": data_pivot.index[-1]+datetime.timedelta(days = 1),
                "coid":col,
                "position":coid_dict.get(col).get("position"),
                "stock_value":0,
            })

    daily_cash_value_record.append(cash)
    value_book = pd.DataFrame(daily_stock_value_record).set_index("mdate")
    value_book = pd.pivot_table(value_book, columns = "coid", index = "mdate")
    value_book["cash_value"] = daily_cash_value_record


    trade_book = trade_book.T
    trade_book.columns = ['coid', 'BuyOrSell', 'BuyTime', 'SellTime', 'CashFlow','TradeUnit', 'HoldingPosition', 'CashValue', 'DealPrice']
    trade_book['mdate'] = [trade_book.BuyTime[i] if trade_book.BuyTime[i] != 0 else trade_book.SellTime[i] for i in trade_book.index]
    trade_book = trade_book.loc[:, ['coid', 'BuyOrSell', 'DealPrice', 'CashFlow', 'TradeUnit', 'HoldingPosition', 'CashValue' ,'mdate']]

    return trade_book, aroon, value_book, order_unit, n)
撰写好交易策略以及输出后,接下来就可以将参数输入函式并执行。
principal = 10e6
cash = principal
order_unit = 0
n = 25

df, aroon, value = Aroon_strategy_multi(data_pivot, principal, cash, order_unit, n)函式会输出三张报表:
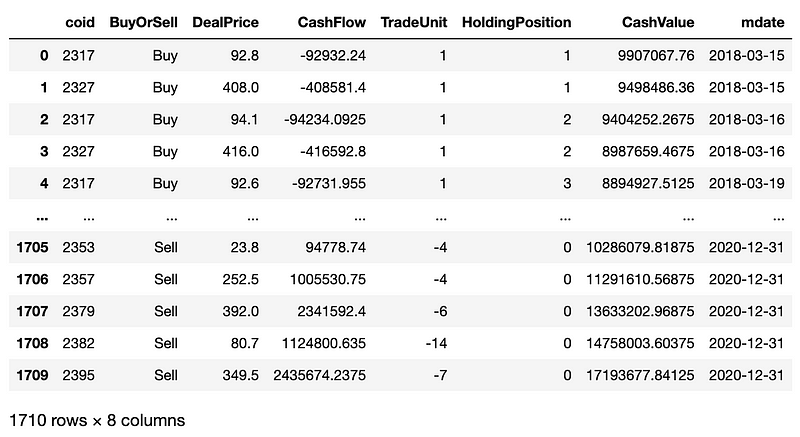
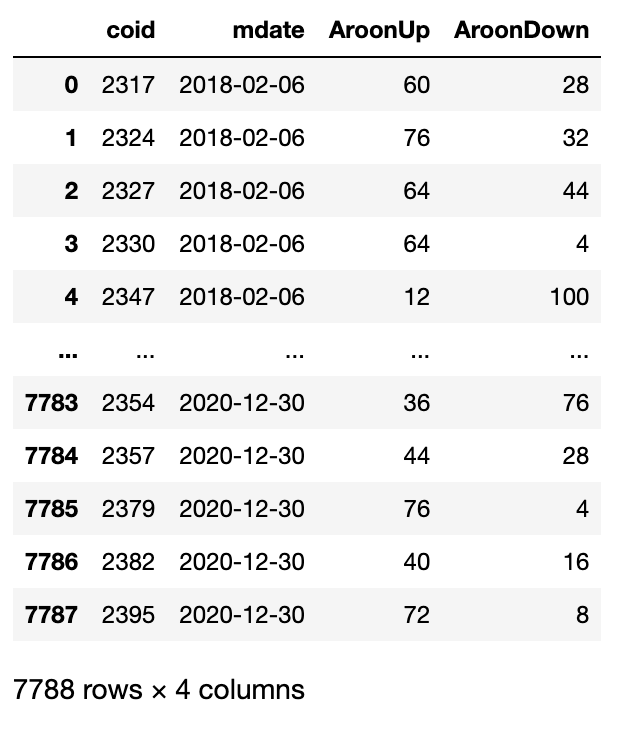
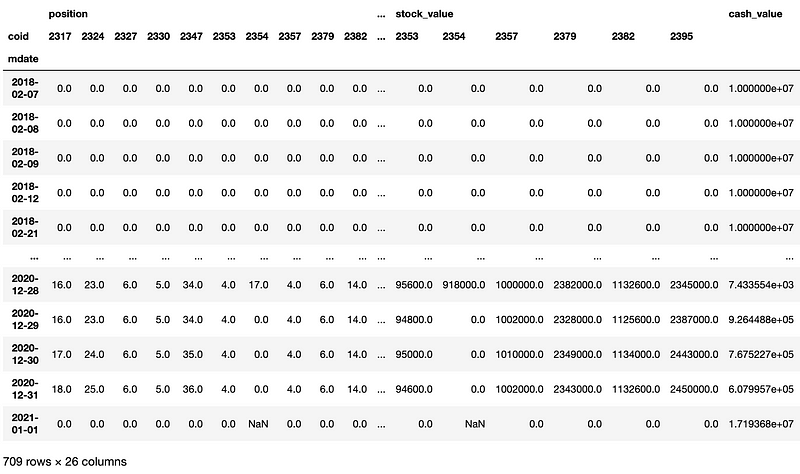
本次实作将计算投资组合的 Alpha 与 Beta 来衡量其绩效,因此我们需要先计算投资组合与大盘的每日报酬率,并将计算结果分别储存至资料表中。
value["total_value"] = value.apply(lambda x : x.sum(), axis = 1)
value["daily_return"] = value["total_value"].pct_change(periods=1)
value["market_return"] = list(stock[stock.coid == "Y9997"]["close_d"].pct_change(periods = 1)[25:])
value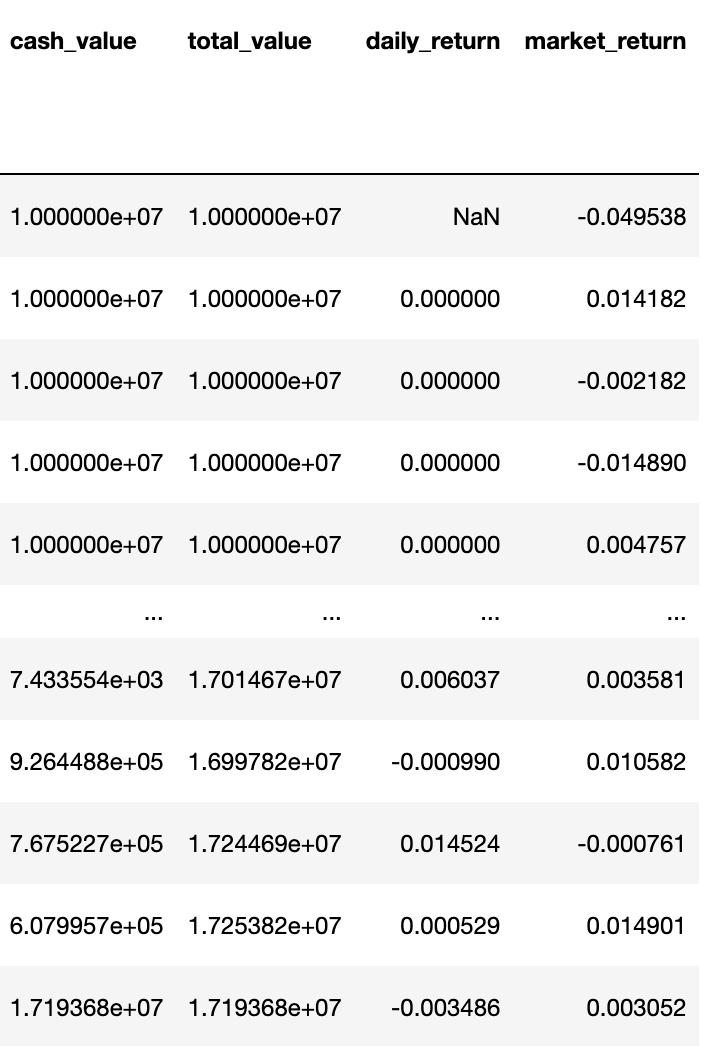
计算好上述资讯后,我们使用 sklearn 来拟合数据,以投资组合每日报酬率大盘每日报酬率进行回归分析。
X = np.array(value["daily_return"].iloc[1:]).reshape(-1, 1)
y = np.array(value["market_return"].iloc[1:])
regressor = LinearRegression()
regressor.fit(X, y)
w_0 = regressor.intercept_
w_1 = regressor.coef_

print('alpha : ', w_0)
print('beta : ', w_1)
我们设定窗口期为 60 天,每日滚动计算 Alpha 与 Beta ,再将数据以视觉化图表来进行分析。
window = 60
alpha = []
beta = []
mdate = []
for i in range(len(value) - window - 1):
    X = np.array(value["daily_return"].iloc[i+1 : i+1+window]).reshape(-1, 1)
    y = np.array(value["market_return"].iloc[i+1 : i+1+window])
    regressor = LinearRegression()
    regressor.fit(X, y)
    w_0 = regressor.intercept_
    w_1 = regressor.coef_
    alpha.append(round(w_0, 5))
    beta.append(w_1)
    mdate.append(value.index[i+1+window])
fig, ax1 = plt.subplots(figsize=[16, 9], constrained_layout=True)
ax1.plot(mdate, alpha, label = "Alpha")
ax1_2 = ax1.twinx()
ax1_2.plot(mdate, beta, label = "Beta", color = "orange")

Alpha_lines, Alpha_labels = ax1.get_legend_handles_labels()
Beta_lines, Beta_labels = ax1_2.get_legend_handles_labels()
ax1.legend(Alpha_lines + Beta_lines,
           Alpha_labels + Beta_labels, loc='upper right')

ax1.set_xlabel('mdate')
ax1.set_ylabel('Alpha')
ax1_2.set_ylabel('Beta')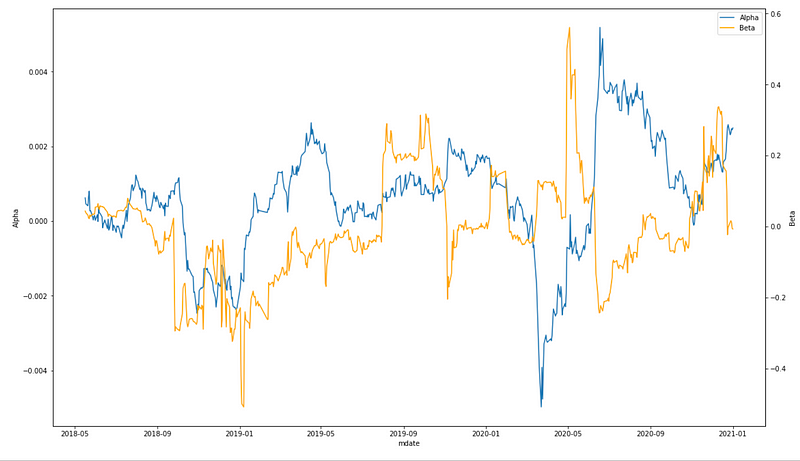
接著,我们再近一步绘制出个标的与大盘的走势比较图,标明买进点、卖出点,以及在回测期间 Aroon 指摽的变化情形。
def make_plot(stock_df, aroon_dict, record_df, coid):
    # stock["mdate"] = stock["mdate"].apply(lambda x:x.strftime('%Y-%m-%d'))
    mdate = stock[stock.coid == "Y9997"].mdate

    benchmark = stock[stock.coid == "Y9997"].close_d

    AroonUp = aroon[aroon.coid == coid].AroonUp
    AroonDown = aroon[aroon.coid == coid].AroonDown
    aroon_date = aroon[aroon.coid == coid].mdate

    fig, axes = plt.subplots(2,1, figsize=[16, 9], constrained_layout=True)

    ax1 = axes[0]
    stock[stock.coid == "Y9997"].set_index("mdate").close_d.plot(ax = ax1, label = "market return")
    ax1_2 = ax1.twinx()
    stock[stock.coid == coid].set_index("mdate").close_d.plot(ax = ax1_2, label=f'{coid}_close', color = "lime")
    stock[stock.coid == coid].set_index("mdate").open_d.plot(ax = ax1_2, label=f'{coid}_open', color = "deeppink", alpha = 0.5)
    ax1_2.scatter(df[df.coid == coid].mdate, df[df.coid == coid].DealPrice, label = "BuyOrSell", color = ["orange" if i == "Buy" else "purple" for i in df[df.coid == coid].BuyOrSell])

    benchmark_lines, benchmark_labels = ax1.get_legend_handles_labels()
    target_lines, target_labels = ax1_2.get_legend_handles_labels()

    ax1.legend(benchmark_lines + target_lines,
               benchmark_labels + target_labels, loc='upper right')
    ax1.set_xlabel('mdate')
    ax1.set_ylabel('index')
    ax1_2.set_ylabel(f'price')
    ax1.set_title(f"{coid}_Aroon")

    ax2 = axes[1]
    aroon[aroon.coid == coid].set_index("mdate").AroonUp.plot(ax = ax2, label = "AroonUp", color = "red")
    ax2_2 = ax2.twinx()
    aroon[aroon.coid == coid].set_index("mdate").AroonDown.plot(ax = ax2_2, label = "AroonDown", color = "green")

    up_lines, up_labels = ax2.get_legend_handles_labels()
    down_lines, down_labels = ax2_2.get_legend_handles_labels()

    ax2.legend(down_lines + down_lines,
               up_labels + down_labels, loc='upper right')
    ax2.set_xlabel('mdate')
    ax2.set_ylabel('Aroon_indicator')

    fig.tight_layout()

    plt.show()
定义完绘图函式后,我们可以透过简单的回圈实现各标的的图表绘制。
请注意由于最后一项标的代码为大盘代码 ”Y9997”,因此回圈仅可取至倒数第二项。
for coid in stock.coid.unique()[:-1]:
    make_plot(stock, aroon, value, coid)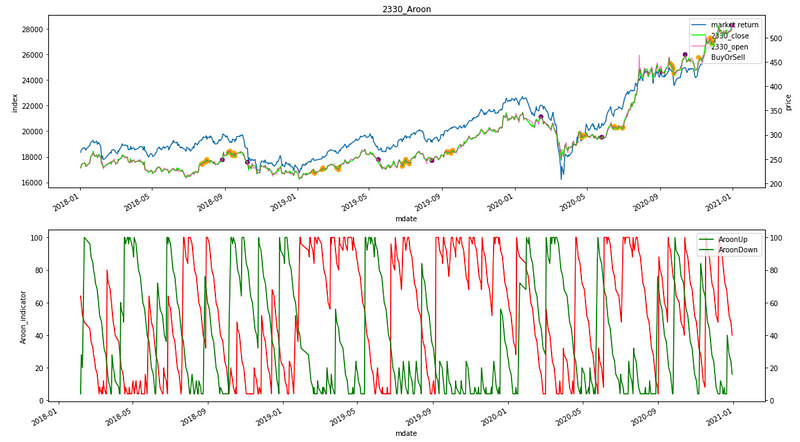
我们以 2330 作为图表范例,在第一张图表中,蓝线为大盘收盘指数、绿线表示标的收盘价、粉线表示标的开盘价、黄点为买进点、紫点为卖出点;而第二张图表中,红线为 Aroon-up、绿线为 Aroon-down。
最后我们简单计算投资组合与大盘的总绩效,可以发现使用 Aroon 指标交易策略的投资组合总绩效胜过大盘约 17%。
print(f'大盘总绩效:{stock[stock.coid == "Y9997"].close_d.iloc[-1]/stock[stock.coid == "Y9997"].close_d.iloc[0] -1}')
print(f'投资组合总绩效:{value["total_value"].iloc[-1]/value["total_value"].iloc[0] -1}')
透过 Alpha & Bate 滚动变化图 可以发现,整体来说,交易策略的 Alpha 与 Beta 的波动幅度都是相对平缓的,代表投资策略相对保守;而从各标的的视觉化报表中可以清楚观察到每支标的各自的买卖点,分析在整个投资组合中,哪些标的才是获利的主要关键。由此延伸,使用者可近一步撰写搭配的选股策略,实现从选股、下单到绩效计算的自动化一条 “隆” 服务。
温馨提醒,本次策略与标的仅供参考,不代表任何商品或投资上的建议。之后也会介绍使用TEJ资料库来建构各式指标,并回测指标绩效,所以欢迎对各种交易回测有兴趣的读者,选购TEJ E-Shop的相关方案,用高品质的资料库,建构出适合自己的交易策略。

电子报订阅