目录
MACD代表“移动平均收敛/发散指标”(Moving Average Convergence Divergence),是一种常用于技术分析的工具,用于衡量一个资产的趋势变化和动能。
MACD由两个主要组件组成:
MACD的计算步骤如下:
MACD的值可以是正值、负值或零,它们之间的相对位置和变化提供了一些关于资产价格趋势的信息。
主要的MACD信号包括:
此外,MACD的柱状图(MACD柱)是快线与慢线之间差值的表示,柱的高度显示了快线和慢线之间的差异。当MACD柱由负变成正,可能暗示着趋势可能正在转为上升。
本文使用 Mac 作业系统以及 jupyter notebook 作为编辑器。
在进入文章主轴之前,我们先传入域名与金钥,接着进行资料导入,
本篇实作使用台积电(2330)作为范例,并设定时间区段为 2018/12/30 ~ 2023/05/26 。
import os
import pandas as pd
import numpy as np

os.environ['TEJAPI_BASE'] = 'https://api.tej.com.tw'
os.environ['TEJAPI_KEY'] = 'your_key'
os.environ['mdate'] = '20181230 20230526'
os.environ['ticker'] = '2330'

# 使用 ingest 将股价资料导入暂存,并且命名该股票组合 (bundle) 为 tquant
!zipline ingest -b tquant

import talib
from zipline.api import order_target, record, symbol
from zipline.finance import commission, slippage
import matplotlib.pyplot as plt首先,我们先建立 initialize 函式inintialize 函式用于定义交易开始前的交易环境,与此例中我们设置:
def initialize(context):
context.sym = symbol('2330')
context.i = 0
context.invested = False
context.set_commission(commission.PerDollar(cost=0.00285))
context.set_slippage(slippage.VolumeShareSlippage())handle_data 函式用于处理每天的交易策略或行动,其中:
我们使用talib来计算移动平均,并设定短期平均窗口期为 12 日、长期平均窗口期为 26日、MACD 线的窗口期为 9 日。
而除了预设输出的报表资讯,我们还想记录在交易策略执行时的收盘价、快线指数、慢线指数、是否买入、是否卖出等资讯,因此在最后的record增加输出栏位。
def handle_data(context, data):
trailing_window = data.history(context.sym, 'price', 35, '1d')#35 = 26 + 9
if trailing_window.isnull().values.any():
return

short_ema = talib.EMA(trailing_window.values, timeperiod = 12)
long_ema = talib.EMA(trailing_window.values, timeperiod = 26)
dif = short_ema - long_ema
MACD = talib.EMA(dif, timeperiod = 9)
bar = dif - MACD
buy = False
sell = False

# Trading logic
#condition1
if (dif[-2] < MACD[-2]) and (dif[-1] > MACD[-1]) and (bar[-2] < 0) and (bar[-1] > 0):

order_target(context.sym, 1000)
context.invested = True
buy = True

#condition2
elif (dif[-2] > MACD[-2]) and (dif[-1] < MACD[-1]) and (bar[-2] > 0) and (bar[-1] < 0) and context.invested:
order_target(context.sym, 0)
context.invested = False
sell = True

# Save values for later inspection
record(TSMC = data.current(symbol('2330'), 'close'),
dif = dif[-1],
MACD = MACD[-1],
bar = bar[-1],
buy = buy,
sell = sell)在analyze中使用 matplotlib.pyplot 绘製 投资组合价值折线图 与 MACD 指标图。
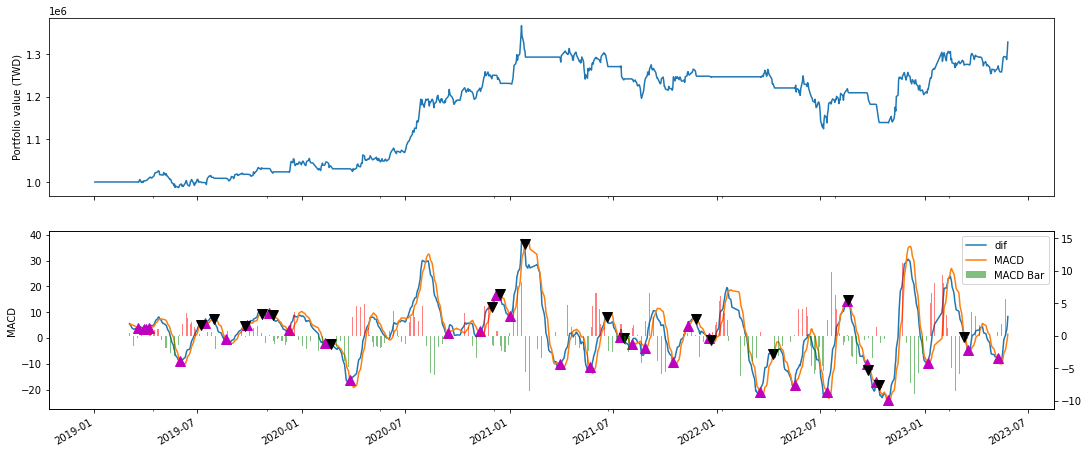
我们计画输出两张图表,第一张为投资组合价值折线图,负责记录投资组合价值的变化趋势;第二张为 MACD 指标图,负责记录 快线、慢线、MACD柱的趋势变化,以及买卖点的标记。
# Note: this function can be removed if running
# this algorithm on quantopian.com
def analyze(context=None, results=None):
import matplotlib.pyplot as plt
import logbook
logbook.StderrHandler().push_application()
log = logbook.Logger('Algorithm')

fig = plt.figure()
ax1 = fig.add_subplot(211)
results.portfolio_value.plot(ax=ax1)
ax1.set_ylabel('Portfolio value (TWD)')
ax2 = fig.add_subplot(212)
ax2.set_ylabel('MACD')
# If data has been record()ed, then plot it.
# Otherwise, log the fact that no data has been recorded.
if 'dif' in results and 'MACD' in results:
results[['dif', 'MACD']].plot(ax=ax2)
ax2.plot(
results.index[results["buy"] == True],
results.loc[results["buy"] == True, 'MACD'],
'^',
markersize=10,
color='m',
)
ax2.plot(
results.index[results["sell"] == True],
results.loc[results["sell"] == True, 'MACD'],
'v',
markersize=10,
color='k',
)
ax3 = ax2.twinx()
colors = ["red" if i > 0 else "green" for i in results['bar']]
ax3.bar(results.index, results['bar'], color=colors, alpha=0.5, width=0.4, label='MACD Bar')

lines, labels = ax2.get_legend_handles_labels()
bars, bar_labels = ax3.get_legend_handles_labels()
ax2.legend(lines + bars, labels + bar_labels, loc='upper right')

plt.gcf().set_size_inches(18, 8)
else:
msg = 'TSMC - dif and MACD data not captured using record().'
ax2.annotate(msg, xy=(0.1, 0.5))
log.info(msg)
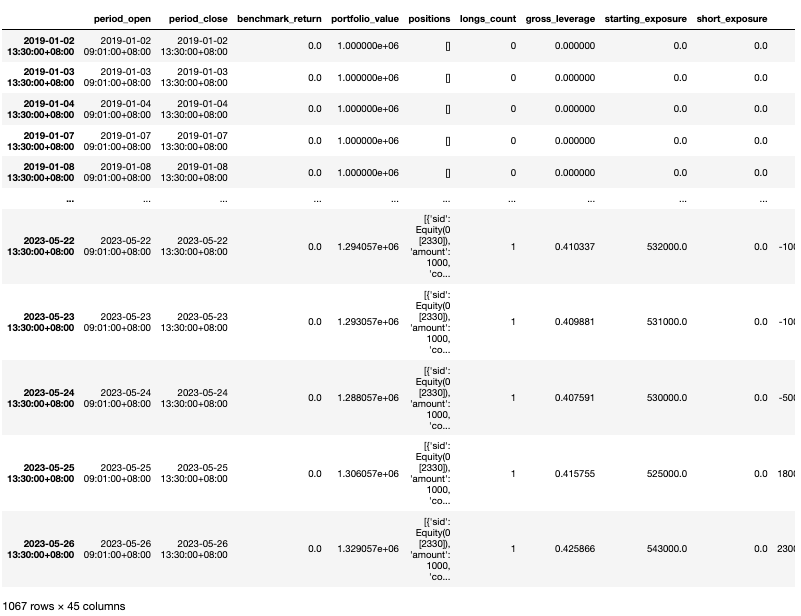
plt.show()使用 run_algorithm 执行上述所编撰的交易策略,设置交易期间为 2018-12-30 到 2023-05-26,初始资金为 100,000 元,所使用资料集为 tquant,其中输出的变数 results 就是每日绩效与交易的明细表。
from zipline import run_algorithm

start_date = pd.Timestamp('2018-12-30',tz='utc')
end_date = pd.Timestamp('2023-05-26',tz='utc')
results = run_algorithm(start= start_date,
end=end_date,
initialize=initialize,
capital_base=1e6,
analyze=analyze,
handle_data=handle_data,
data_frequency='daily',
bundle='tquant'
)

由上述报表中,我们可以看到投组价值约增加了百分之三十,而经由MACD 指标图可以明确了解每个交易动作的时间点及趋势表现。透过TQuant Lab,能大幅度的减少程式码的複杂度,使用少量程式码即可实现複杂回测系统。然而需要注意的是,虽然MACD是一个流行的技术分析工具,但它并非绝对可靠,单独使用可能会产生虚假的信号。通常,技术分析者会将MACD与其他指标和分析方法结合使用,以做出更准确的判断。
温馨提醒,本次策略与标的仅供参考,不代表任何商品或投资上的建议。之后也会介绍使用TEJ资料库来建构各式指标,并回测指标绩效,所以欢迎对各种交易回测有兴趣的读者,选购 TEJ E-Shop 的相关方案,用高品质的资料库,建构出适合自己的交易策略。

电子报订阅